
Making Your Non-Profit’s Annual Report Sing: Creative Strategies to Impress Stakeholders
Elevate your Non-Profit’s Annual Report with creative strategies to captivate stakeholders and showcase your impact.
Annual reports are essential tools for non-profits, businesses, and other organizations, serving multiple vital functions. They enhance accountability and transparency by providing detailed information about the organization’s activities, financial performance, and achievements over the past year, thereby building trust with stakeholders such as donors, members, partners, and the general public.
These reports also play a crucial role in fundraising and donor relations, showcasing the impact of donations and grants, strengthening relationships with current donors, and attracting new ones.
Additionally, annual reports are key communication tools, keeping stakeholders informed about the organization’s progress, strategic direction, and future goals.
They serve as marketing and public relations assets, highlighting successes and contributions to the community to build a positive public image.
By offering a platform for performance measurement and evaluation, annual reports help organizations reflect on their achievements, identify areas for improvement, and plan strategically for the future.
They also ensure regulatory compliance, serve as historical records, and engage and inspire stakeholders, making them indispensable for any organization’s ongoing success and growth.
The time required to produce an annual report for an organization can vary widely based on several factors such as the size of the organization, the complexity of its operations, the level of detail required, and the resources available. Typically, the process can take anywhere from a few weeks to several months.
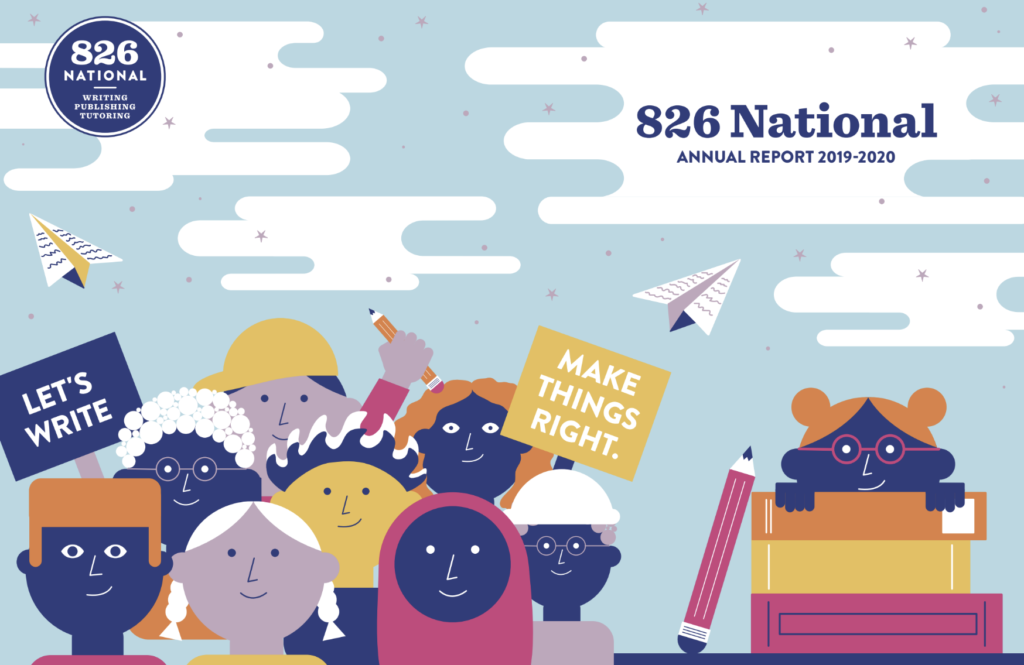
Case Study: 826 National
When it comes to creating impactful annual reports, smaller non-profits like 826 National set a stellar example. I’m genuinely excited to share their approach because it’s just so impressive and inspirational!
Known for their creative and playful design, 826 National’s reports shine with colourful graphics, engaging layouts, and fun illustrations, all reflecting their mission of fostering youth creativity in writing.
They masterfully incorporate storytelling through testimonials from students and volunteers, making their reports both informative and emotionally engaging.
They also use interactive PDFs with clickable links and animated elements, presenting impact metrics and financial information through infographics, ensuring transparency and ease of understanding for stakeholders.
Imagine, you can do this too! With our content creation team, See Girl Work can help you bring this level of creativity and engagement to your own annual reports.
With compelling visuals, interactive elements, clear data presentation, and heartfelt stories, we can transform your report into a dynamic showcase of your achievements. Let’s make your non-profit’s annual report sing!
Making Your Non-Profit’s Annual Report Sing!
As a small non-profit, I know your resources are tight, and your time is precious, so transforming your annual report into a powerful storytelling tool that wows your stakeholders without overwhelming your team might be a tall order.
But here’s why it’s worth it — annual reports aren’t just about compliance and numbers; they’re your chance to showcase your impact and engage your audience deeply. Here’s how to turn this yearly task into an inspiring testament to your advocacy work.
1. Embrace Video Annual Reports
Videos are a dynamic, engaging way to showcase your work. They capture emotions and stories in a way that text alone can’t. Mix professional footage with clips from staff and volunteers to add authenticity.
Benefits:
- Captures emotional engagement.
- Easily shared on social media and your website.
- Tells your story in a compelling, visual format.
2. Create a Microsite
A dedicated microsite offers an interactive, immersive experience. Unlike static PDFs, microsites can feature videos, animations, and interactive elements, making it easier for stakeholders to find the info they care about most.
Features to Include:
- Interactive data visualizations.
- Embedded videos and audio clips.
- Downloadable resources for detailed insights.
3. Use Iconography and Illustrations
Visuals can make your report more appealing and easier to digest. Infographics simplify complex data, while illustrations add a personal, engaging touch.
Tips:
- Icons to highlight key metrics.
- Illustrations that reflect your mission.
- Consistent style and colours to reinforce your brand.
4. Incorporate Employee and Beneficiary Testimonials
Personal stories from those you help and those who work with you bring your report to life. Testimonials provide first-hand accounts of your impact.
How to Use:
- Written testimonials with photos.
- Video clips or audio snippets.
- Quotes in social media graphics to drive traffic to your report.
5. Showcase Advocacy Work Through Case Studies
Case studies demonstrate your efforts and impact in detail. Highlight specific projects, challenges, strategies, and outcomes.
Structure:
- Introduce the problem.
- Describe your actions.
- Present results and personal stories.
6. Engage with Interactive Elements
Interactive features like clickable maps and timelines make your report more engaging and informative. These allow stakeholders to explore what interests them most.
Ideas:
- Interactive maps showing geographical impact.
- Timelines of key events.
- Clickable charts and graphs for deeper insights.
7. Use Strong Visuals
High-quality visuals can significantly enhance your report. Use photos of events, projects, and the communities you serve to tell a powerful story.
Best Practices:
- Use authentic, high-quality images.
- Include captions for context.
- Balance visuals with text.
8. Interactive PDFs with Animation and Motion Graphics
Interactive PDFs can bring your report to life with animations and motion graphics. These features make complex data digestible and engaging, providing a multimedia experience.
Benefits:
- Engaging animations and transitions.
- Interactive experience within a familiar format.
- Easily distributed via email or downloads.
Features to Include:
- Animated charts and graphs.
- Motion graphics for key achievements.
- Interactive buttons and links.
We Can Help!
Ready to make your annual report sing? Strategize with See Girl Work to create a compelling, visually stunning annual report that informs and inspires.
Our team specializes in crafting engaging reports that highlight your advocacy work and leave a lasting impression on your stakeholders.
Contact us today to elevate your next annual report!
Image via Pexels

Storytelling for Non-Profits: How to Convey Your Impact and Mission
Storytelling for non-profits. Learn how to master this timeless art to captivate your audience and d
Transforming “Hello, Ontario” for Newcomers Living with HIV/AIDS: Our Web Design and Development Process
An inside look at our web design and development process for “Hello, Ontario” a website

11 Email Marketing Platforms That Will Make Your Non-Profit Newsletters Shine
Choosing the right email marketing platform for your non-profit newsletters is crucial for enhancing
Leave a Reply
You must be logged in to post a comment.